

Question: Use the data in the contingency table to answer 15. Find the approximate p-value for the test and interpret its value. Column Row 1 2
Use the data in the contingency table to answer
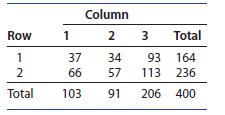
15. Find the approximate p-value for the test and interpret its value.
Column Row 1 2 3 Total - 1 37 34 93 164 2 66 57 113 236 Total 103 91 206 400
Step by Step Solution
There are 3 Steps involved in it
1 Expert Approved Answer
Step: 1 Unlock

Question Has Been Solved by an Expert!
Get step-by-step solutions from verified subject matter experts
Step: 2 Unlock
Step: 3 Unlock