

Question: Use the data set and the MINITAB output (Exercise 18, Section 12.1) below to answer 9. Find a 95% confidence interval for the average value
Use the data set and the MINITAB output
(Exercise 18, Section 12.1) below to answer
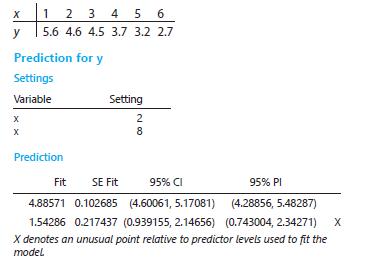
9. Find a 95% confidence interval for the average value of y when x52.
x 1 2 3 4 5 6 y 5.6 4.6 4.5 3.7 3.2 2.7 Prediction for y Settings Variable X X Setting 28 Prediction Fit SE Fit 95% CI 95% Pl 4.88571 0.102685 (4.60061, 5.17081) 1.54286 0.217437 (0.939155, 2.14656) (4.28856, 5.48287) (0.743004, 2.34271) X denotes an unusual point relative to predictor levels used to fit the model X
Step by Step Solution
There are 3 Steps involved in it
1 Expert Approved Answer
Step: 1 Unlock

Question Has Been Solved by an Expert!
Get step-by-step solutions from verified subject matter experts
Step: 2 Unlock
Step: 3 Unlock