

Question: Use the data set and the MINITAB output (Exercise 18, Section 12.1) below to answer 11. The last line in the second section of the
Use the data set and the MINITAB output
(Exercise 18, Section 12.1) below to answer
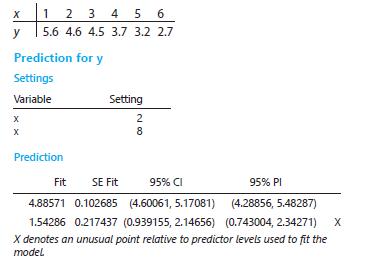
11. The last line in the second section of the printout indicates a problem with one of the fitted values. What value of x corresponds to the fitted value yˆ51.54286?
What problem has the MINITAB program detected?
x 1 2 3 4 5 6 y 5.6 4.6 4.5 3.7 3.2 2.7 Prediction for y Settings Variable X X Setting 28 Prediction Fit SE Fit 95% CI 95% Pl 4.88571 0.102685 (4.60061, 5.17081) 1.54286 0.217437 (0.939155, 2.14656) (4.28856, 5.48287) (0.743004, 2.34271) X denotes an unusual point relative to predictor levels used to fit the model X
Step by Step Solution
There are 3 Steps involved in it

Get step-by-step solutions from verified subject matter experts