

Question: Compute the biased and unbiased standard deviations for Distribution 6 in Table 3.2. Table 3.2 Distribution 3 6. 4 7.0 7.2 40.2 7.0 10.0 97.8
Table 3.2
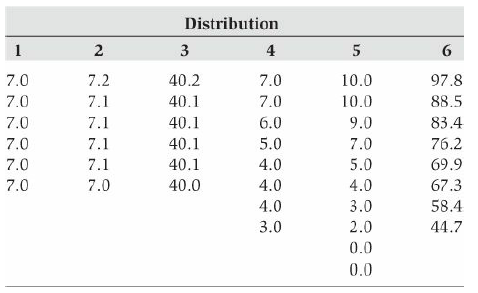
Distribution 3 6. 4 7.0 7.2 40.2 7.0 10.0 97.8 7.0 7.1 40.1 7.0 10.0 88.5 7.0 7.1 40.1 6.0 9.0 83.4 40.1 5.0 76.2 7.0 7.1 7.0 5.0 7.0 7.1 40.1 4.0 69.9 7.0 7.0 40.0 4.0 4.0 67.3 58.4 4.0 3.0 3.0 2.0 44.7 0.0 0.0
Step by Step Solution
★★★★★
3.46 Rating (179 Votes )
There are 3 Steps involved in it
1 Expert Approved Answer
Step: 1 Unlock

For Di... View full answer
Question Has Been Solved by an Expert!
Get step-by-step solutions from verified subject matter experts
Step: 2 Unlock
Step: 3 Unlock