

Question: The data from Exercise 7 in Chapter 7 are reproduced in the following table. Calculate the mean and the unbiased standard deviations for both the
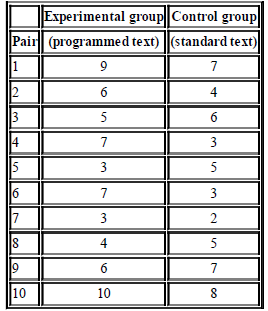
Data from exercise 7(chapter 7)
Test the results for statistical significance at the .05 level. What should the psychologist decide about his or her new programmed text?
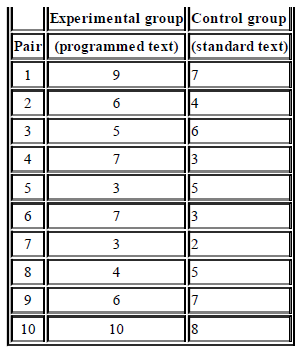
Experimental group||Control group| Pair (programmed text) (standard text) 4 5 14 15 3 3 3 2 18 4 5 19 6 10 10 3. Experimental group||Control group Pair (programmed text) (standard text) 3 5 4 5 3 4 15 6. 10 10 6. 3. 3. 3.
Step by Step Solution
★★★★★
3.37 Rating (156 Votes )
There are 3 Steps involved in it
1 Expert Approved Answer
Step: 1 Unlock

Retain H 0 possible Type II ... View full answer
Question Has Been Solved by an Expert!
Get step-by-step solutions from verified subject matter experts
Step: 2 Unlock
Step: 3 Unlock