

Question: Data points sx, yd are given. (a) Draw a scatter plot of the data points. (b) Make semilog and log-log plots of the data. (c)
Data points sx, yd are given.
(a) Draw a scatter plot of the data points.
(b) Make semilog and log-log plots of the data.
(c) Is a linear, power, or exponential function appropriate for modeling these data?
(d) Find an appropriate model for the data and then graph the model together with a scatter plot of the data.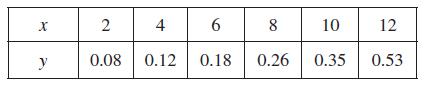
x 2 4 6 8 10 12 y 0.08 0.12 0.18 0.26 0.35 0.53
Step by Step Solution
There are 3 Steps involved in it
1 Expert Approved Answer
Step: 1 Unlock

Question Has Been Solved by an Expert!
Get step-by-step solutions from verified subject matter experts
Step: 2 Unlock
Step: 3 Unlock