

(a) Draw a Lorenz curve and calculate the Gini coefficient for the wealth data in Chapter 1...
Question:
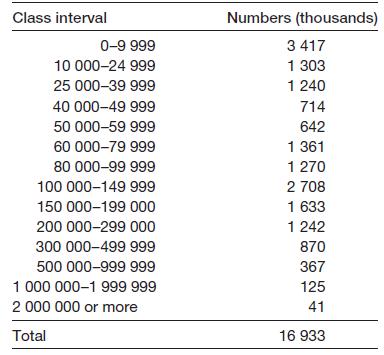
(a) Draw a Lorenz curve and calculate the Gini coefficient for the wealth data in Chapter 1 (Table 1.3).
(b) Why is the Gini coefficient typically larger for wealth distributions than for income distributions?
Table 1.3
Fantastic news! We've Found the answer you've been seeking!
Step by Step Answer:
a The Lorenz curve has been plotted as shown in the graph above The Gini coefficient which is calcul...View the full answer

Answered By
JAPHETH KOGEI
Hi there. I'm here to assist you to score the highest marks on your assignments and homework. My areas of specialisation are:
Auditing, Financial Accounting, Macroeconomics, Monetary-economics, Business-administration, Advanced-accounting, Corporate Finance, Professional-accounting-ethics, Corporate governance, Financial-risk-analysis, Financial-budgeting, Corporate-social-responsibility, Statistics, Business management, logic, Critical thinking,
So, I look forward to helping you solve your academic problem.
I enjoy teaching and tutoring university and high school students. During my free time, I also read books on motivation, leadership, comedy, emotional intelligence, critical thinking, nature, human nature, innovation, persuasion, performance, negotiations, goals, power, time management, wealth, debates, sales, and finance. Additionally, I am a panellist on an FM radio program on Sunday mornings where we discuss current affairs.
I travel three times a year either to the USA, Europe and around Africa.
As a university student in the USA, I enjoyed interacting with people from different cultures and ethnic groups. Together with friends, we travelled widely in the USA and in Europe (UK, France, Denmark, Germany, Turkey, etc).
So, I look forward to tutoring you. I believe that it will be exciting to meet them.
2+ Reviews
10+ Question Solved
Related Book For 

Statistics For Economics Accounting And Business Studies
ISBN: 978027368308
4th Edition
Authors: Michael Barrow
Question Posted:
