

The table below shows the different categories of investment, 19832002. Use appropriate graphical techniques to analyse the
Question:
The table below shows the different categories of investment, 1983–2002.
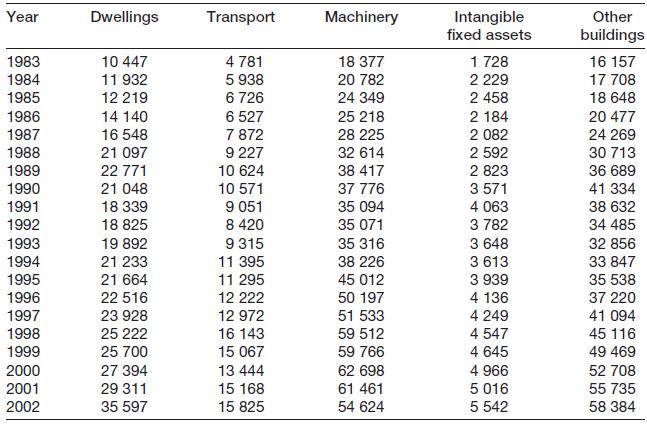
Use appropriate graphical techniques to analyse the properties of any one of the investment series. Comment upon the results.
Fantastic news! We've Found the answer you've been seeking!
Step by Step Answer:
To analyze the table of different categories of investment ...View the full answer

Answered By
Diksha Bhasin
I have been taking online teaching classes from past 5 years, i.e.2013-2019 for students from classes 1st-10th. I also take online and home tuitions for classes 11th and 12th for subjects – Business Studies and Economics from past 3 years, i.e. from 2016-2019. I am eligible for tutoring Commerce graduates and post graduates. I am a responsible for staying in contact with my students and maintaining a high passing rate.
1+ Reviews
10+ Question Solved
Related Book For 
Statistics For Economics Accounting And Business Studies
ISBN: 978027368308
4th Edition
Authors: Michael Barrow
Question Posted:
