

Question: Using the data from Problem 1.14: (a) Calculate the average rate of growth of the series for dwellings. (b) Calculate the standard deviation around the
Using the data from Problem 1.14:
(a) Calculate the average rate of growth of the series for dwellings.
(b) Calculate the standard deviation around the average growth rate.
(c) Does the series appear to be more or less volatile than the investment figures used in the chapter? Suggest reasons.
Problem 1.14
The table below shows the different categories of investment, 1983–2002.
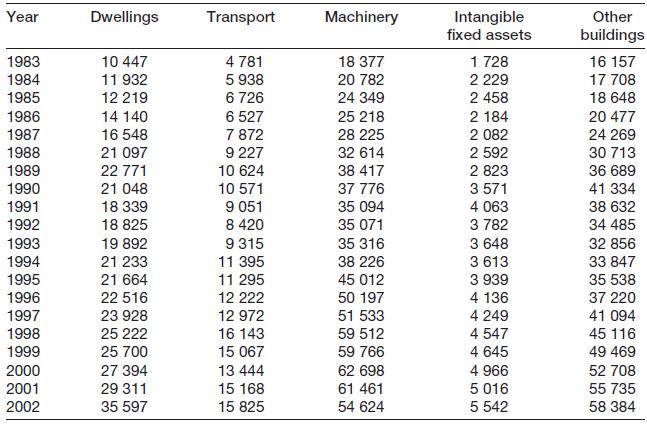
Year Dwellings Transport Machinery Intangible fixed assets Other buildings 1983 10 447 4 781 18 377 1 728 16 157 1984 11 932 5 938 20 782 2 229 17 708 1985 12 219 6 726 24 349 2 458 18 648 1986 14 140 6 527 25 218 2 184 20 477 1987 16 548 7 872 28 225 2 082 24 269 1988 21 097 9 227 32 614 2 592 30 713 1989 22 771 10 624 38 417 2 823 36 689 1990 21 048 10 571 37 776 3 571 41 334 9 051 8 420 1991 18 339 35 094 4 063 38 632 1992 18 825 35 071 3 782 34 485 9 315 11 395 3 648 3 613 1993 19 892 32 856 35 316 38 226 1994 21 233 21 664 33 847 1995 11 295 45 012 3 939 35 538 1996 22 516 12 222 50 197 4 136 37 220 23 928 25 222 1997 12 972 51 533 4 249 41 094 1998 16 143 59 512 4 547 45 116 49 469 1999 25 700 15 067 59 766 4 645 2000 27 394 13 444 62 698 4 966 52 708 61 461 54 624 2001 29 311 15 168 5 016 55 735 2002 35 597 15 825 5 542 58 384
Step by Step Solution
3.28 Rating (157 Votes )
There are 3 Steps involved in it
To calculate the average rate of growth of the series for dwellings and the standard deviation around the average growth rate we will use the formula ... View full answer

Get step-by-step solutions from verified subject matter experts