

Question: Repeat Exercise 3, using the S chart in place of the R chart. Repeat Exercise 3. Samples of three resistors are taken periodically, and the
Repeat Exercise 3, using the S chart in place of the R chart.
Repeat Exercise 3.
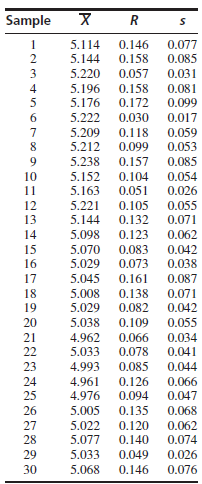
Samples of three resistors are taken periodically, and the resistances, in ohms, are measured. The following table presents the means, ranges, and standarddeviations for 30 consecutive samples.
The means are X = 5.095, R = 0.110, and s = 0.058.
a. Compute the 3σ limits for the R chart. Is the variance out of control at any point? If so, delete the samples that are out of control and recompute X and R.
b. Compute the 3σ limits for the X chart. On the basis of the 3σ limits, is the process mean in control? If not, at what point is it first detected to be out of control?
c. On the basis of the Western Electric rules, is the process mean in control? If not, when is it first detected to be out of control?
Sample 1 5.114 0.146 0.077 5.144 0.158 0.085 3 5.220 0.057 0.031 4 5.196 0.158 0.081 5.176 0.172 0.099 6. 5.222 0.030 0.017 7 5.209 0.118 0.059 8. 5.212 0.099 0.053 0.085 9. 10 11 5.238 0.157 5.152 0.104 0.054 5.163 0.051 0.026 12 5.221 0.105 0.055 13 5.144 0.132 0.071 14 5.098 0.123 0.062 0.042 0.038 15 5.070 0.083 16 5.029 0.073 0.161 17 5.045 0.087 18 5.008 0.138 0.071 19 5.029 0.082 0.042 20 5.038 0.109 0.055 21 4.962 0.066 0.078 0.034 22 5.033 0.041 23 4.993 0.085 0.044 24 4.961 0.126 0.066 25 4.976 0.094 0.047 26 5.005 0.135 0.068 27 28 0.120 0.140 5.022 0.062 5.077 0.074 29 5.033 0.049 0.026 30 5.068 0.146 0.076
Step by Step Solution
3.34 Rating (169 Votes )
There are 3 Steps involved in it
a The sample size is n 3 The upper and lower limits for the Schart a... View full answer

Get step-by-step solutions from verified subject matter experts