

Question: Repeat Exercise 3, using the S chart in place of the R chart. Repeat Exercise 3 The means are X = 2.505, R = 0.1395,
Repeat Exercise 3, using the S chart in place of the R chart.
Repeat Exercise 3
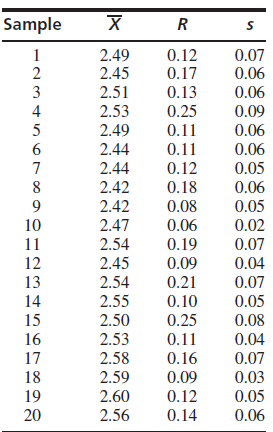
The means are X̅ = 2.505, R̅ = 0.1395, and s̅ = 0.057.
a. Calculate the 3σ control limits for the R̅ chart. Is the variance under control? If not, delete the samples that are out of control and recompute X̅ and R̅.
b. Based on the sample range R, calculate the 3σ control limits for the X̅ chart. Based on the 3σ limits, is the process mean in control? If not, when is it first detected to be out of control?
c. Based on the Western Electric rules, is the process mean in control? If not, when is it first detected to be out of control?
Sample R 1 2 2.49 2.45 0.12 0.17 0.07 0.06 3 2.51 0.13 0.06 4 2.53 0.25 0.09 2.49 0.11 0.06 2.44 0.11 0.06 7 2.44 0.12 0.05 8 2.42 0.18 0.06 9 2.42 0.08 0.05 10 2.47 0.06 0.02 11 2.54 0.19 0.07 12 2.45 0.09 0.04 2.54 2.55 13 0.21 0.07 14 0.10 0.05 15 2.50 0.25 0.08 16 2.53 0.11 0.04 17 2.58 0.16 0.07 18 2.59 0.09 0.03 19 2.60 0.12 0.05 20 2.56 0.14 0.06
Step by Step Solution
3.42 Rating (155 Votes )
There are 3 Steps involved in it
a The sample size is n 5 The upper and lower limits for the Schart are B ... View full answer

Get step-by-step solutions from verified subject matter experts