

Question: Repeat Exercise 3, using the (S) chart in place of the (R) chart. Data From Exercise 3: The thickness, in mm, of metal washers is
Repeat Exercise 3, using the \(S\) chart in place of the \(R\) chart.
Data From Exercise 3:
The thickness, in mm, of metal washers is measured on samples of size 5. The following table presents the means, ranges, and standard deviations for 20 consecutive samples.
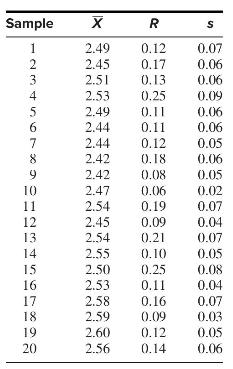
The means are \(\overline{\bar{X}}=2.505, \bar{R}=0.1395\), and \(\bar{s}=0.057\).
Sample 1 2 3 4 5 6 7 8 9 10 11 12 13 14 15 16 17 18 19 20 X 2.49 2.45 2.51 2.53 2.49 2.44 2.44 2.42 2.42 2.47 2.54 2.45 2.54 2.55 2.50 2.53 2.58 2.59 2.60 2.56 R 0.12 0.17 0.13 S 0.07 0.06 0.06 0.25 0.09 0.11 0.06 0.11 0.06 0.12 0.05 0.18 0.06 0.08 0.05 0.06 0.02 0.19 0.07 0.09 0.04 0.21 0.07 0.10 0.05 0.25 0.08 0.11 0.04 0.16 0.07 0.09 0.03 0.12 0.05 0.14 0.06
Step by Step Solution
There are 3 Steps involved in it
The task is to construct an Schart Standard Deviation Control Chart for the given data rather than u... View full answer

Get step-by-step solutions from verified subject matter experts