

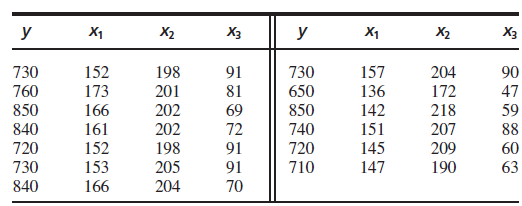
Question: The article Multiple Linear Regression for Lake Ice and Lake Temperature Characteristics (S. Gao and H. Stefan, Journal of Cold Regions Engineering, 1999:5977) presents data
a. Fit the model y = β0+β1x1+β2x2+β3x3+ε. For each coefficient, find the P-value for testing the null hypothesis that the coefficient is equal to 0.
b. If two lakes differ by 2 in the average number of days per year of ice cover, with other variables being equal, by how much would you expect their maximum ice thicknesses to differ?
c. Do lakes with greater average snow depth tend to have greater or lesser maximum ice thickness? Explain.
X2 y X1 X X1 X2 X3 152 173 198 201 202 730 204 172 218 90 47 59 88 730 157 136 142 91 760 850 81 69 650 166 161 152 153 850 202 198 740 720 710 151 145 147 840 72 207 720 730 91 209 60 63 205 91 190 840 166 204 70
Step by Step Solution
3.46 Rating (169 Votes )
There are 3 Steps involved in it
a b By 353682 70736 c Less thickness because the ... View full answer

Get step-by-step solutions from verified subject matter experts