

The following MINITAB output presents the results of a hypothesis test for a population proportion p. a.
Question:
The following MINITAB output presents the results of a hypothesis test for a population proportion p.
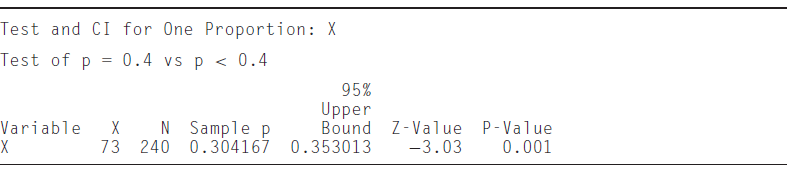
a. Is this a one-tailed or two-tailed test?
b. What is the null hypothesis?
c. Can H0 be rejected at the 2% level? How can you tell?
d. Someone asks you whether the null hypothesis H0 : p ?? 0.45 versus H1 : p < 0.45 can be rejected at the 2% level. Can you answer without doing any calculations? How?
e. Use the output and an appropriate table to compute the P-value for the test of H0 : p ?? 0.25 versus H1 : p > 0.25.
f. Use the output and an appropriate table to compute a 90% confidence interval for p.
Fantastic news! We've Found the answer you've been seeking!
Step by Step Answer:
a Onetailed The alternate hypothesis is of the form p p 0 b H 0 p 04 c Y...View the full answer

Answered By
Saleem Abbas
Have worked in academic writing for an a years as my part-time job.
1+ Reviews
10+ Question Solved
Related Book For 
Question Posted:
