

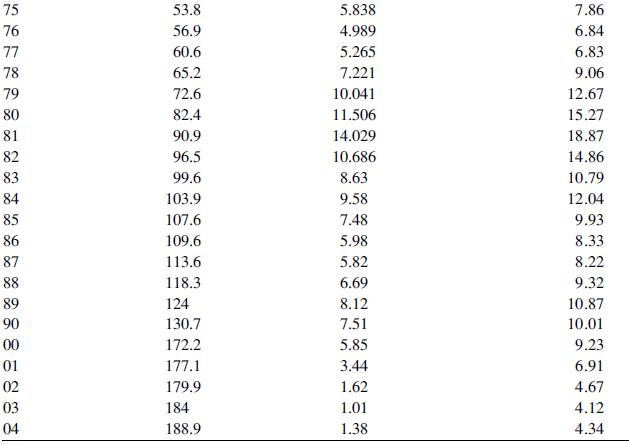
Use the data in Table 2.1 to draw line charts for the following: (a) GNP (b) CPI
Question:
Use the data in Table 2.1 to draw line charts for the following:
(a) GNP
(b) CPI
(c) GNP and CPI
(d) 3-month T-bill rate and prime rate
Table 2.1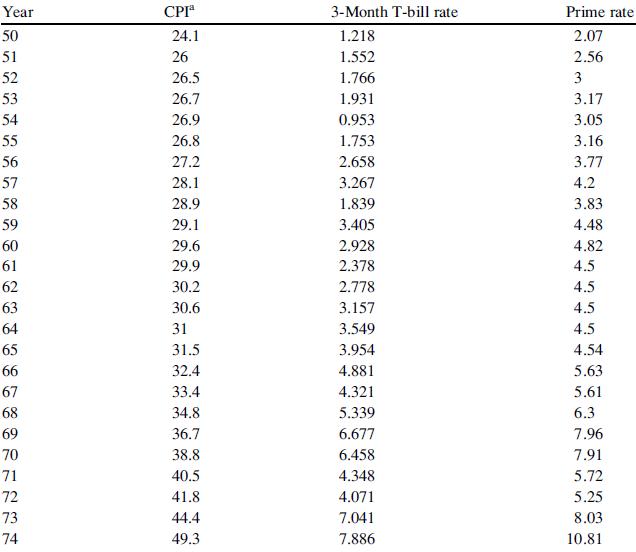
Step by Step Answer:

This question has not been answered yet.
You can Ask your question!
Related Book For 

Statistics For Business And Financial Economics
ISBN: 9781461458975
3rd Edition
Authors: Cheng Few Lee , John C Lee , Alice C Lee
Question Posted:
