

Question: 1.15 A simple histogram is also a useful chart as a quality improvement tool. The frequency histogram of quality measurements on the diameters of 500
1.15 A simple histogram is also a useful chart as a quality improvement tool. The frequency histogram of quality measurements on the diameters of 500 steel rods is given in Figure below.
These rods had a lower specification limit (LSL)
of 1.0 centimeter, and rods with diameters under the LSL were declared defective.
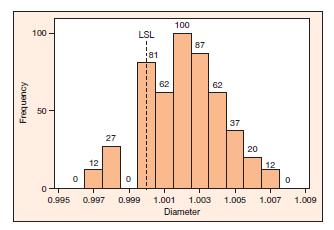
a What percent of rods were declared defective?
b Do you see anything unusual in this histogram?
Can you offer a possible explanation of what is happening here?
100- LSL 181 100 87 Frequency g 50- 0 0 12 27 62 62 0.995 0.997 0.999 1.001 1.003 Diameter 37 20 12 0 1.005 1.007 1.009
Step by Step Solution
There are 3 Steps involved in it

Get step-by-step solutions from verified subject matter experts