

Question: Repeat Exercise 12, using the S S chart in place of the R R chart. Data From Exercise 12: Copper wires are coated with a
Repeat Exercise 12, using the chart in place of the chart.
Data From Exercise 12:
Copper wires are coated with a thin plastic coating. Samples of four wires are taken every hour, and the thickness of the coating (in mils) is measured. The data from the last 30 samples are presented in Table E12. The means are \(\overline{\bar{X}}=150.075\), \(\bar{R}=6.97\), and \(\bar{s}=3.082\).
Table E12:
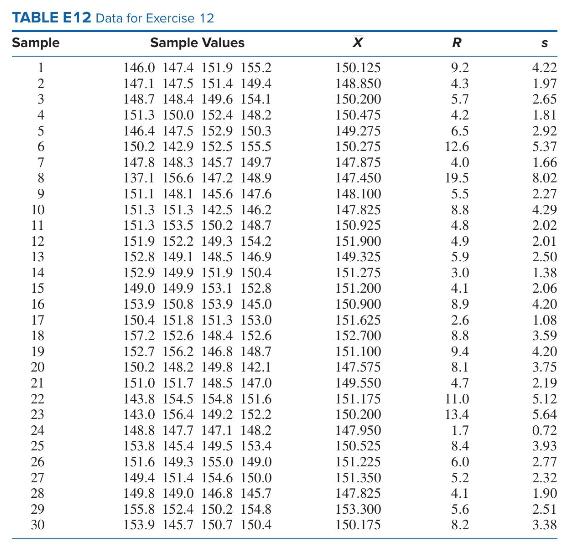
TABLE E12 Data for Exercise 12 Sample 1 as345 6 8 9 10 11 12 13 14 15 16 17 18 19 20 21 22 23 24 25 26 27 28 29 30 Sample Values 146.0 147.4 151.9 155.2 147.1 147.5 151.4 149.4 148.7 148.4 149.6 154.1 151.3 150.0 152.4 148.2 146.4 147.5 152.9 150.3 150.2 142.9 152.5 155.5 147.8 148.3 145.7 149.7 137.1 156.6 147.2 148.9 151.1 148.1 145.6 147.6 151.3 151.3 142.5 146.2 151.3 153.5 150.2 148.7 151.9 152.2 149.3 154.2 152.8 149.1 148.5 146.9 152.9 149.9 151.9 150.4 149.0 149.9 153.1 152.8 153.9 150.8 153.9 145.0 150.4 151.8 151.3 153.0 157.2 152.6 148.4 152.6 152.7 156.2 146.8 148.7 150.2 148.2 149.8 142.1 151.0 151.7 148.5 147.0 143.8 154.5 154.8 151.6 143.0 156.4 149.2 152.2 148.8 147.7 147.1 148.2 153.8 145.4 149.5 153.4 151.6 149.3 155.0 149.0 149.4 151.4 154.6 150.0 149.8 149.0 146.8 145.7 155.8 152.4 150.2 154.8 153.9 145.7 150.7 150.4 X 150.125 148.850 150.200 150.475 149.275 150.275 147.875 147.450 148.100 147.825 150.925 151.900 149.325 151.275 151.200 150.900 151.625 152.700 151.100 147.575 149.550 151.175 150.200 147.950 150.525 151.225 151.350 147.825 153.300 150.175 R 9.2 4.3 5.7 4.2 6.5 12.6 4.0 19.5 5.5 8.8 4.8 4.9 5.9 3.0 4.1 8.9 2.6 8.8 9.4 8.1 4.7 11.0 13.4 1.7 8.4 6.0 5.2 4.1 5.6 8.2 S 4.22 1.97 2.65 1.81 2.92 5.37 1.66 8.02 2.27 4.29 2.02 2.01 2.50 1.38 2.06 4.20 1.08 3.59 4.20 3.75 2.19 5.12 5.64 0.72 3.93 2.77 2.32 1.90 2.51 3.38
Step by Step Solution
3.32 Rating (155 Votes )
There are 3 Steps involved in it
I can provide a detailed explanation of how to use the S chart also known as the standard deviation chart in statistical process control SPC as a subs... View full answer

Get step-by-step solutions from verified subject matter experts