

Question: Repeat Exercise 8, using the (S) chart in place of the (R) chart. Data From Exercise 8: Samples of eight bolts are taken periodically, and
Repeat Exercise 8, using the \(S\) chart in place of the \(R\) chart.
Data From Exercise 8:
Samples of eight bolts are taken periodically, and their diameters (in \(\mathrm{mm}\) ) are measured. The following table presents the means, ranges, and standard deviations for 25 consecutive samples.
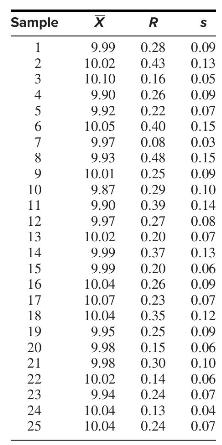
The means are \(\overline{\bar{X}}=9.9892, \bar{R}=0.2628\), and \(\bar{s}=\) 0.0880 .
Sample X 1234567x 8 9 10 11 12 13 14 15 16 17 18 19 20 21 22 23 24 25 R S 0.28 0.09 0.43 0.13 0.16 0.05 0.09 0.07 0.40 0.15 9.97 0.08 0.03 9.93 0.48 0.15 10.01 0.25 0.09 9.87 0.29 0.10 9.90 0.39 0.14 9.97 0.27 0.08 10.02 0.20 0.07 9.99 0.37 0.13 9.99 0.20 0.06 10.04 0.26 0.09 10.07 0.23 0.07 10.04 0.35 0.12 9.95 0.25 0.09 9.98 9.98 10.02 9.94 10.04 10.04 9.99 10.02 10.10 9.90 9.92 10.05 0.26 0.22 0.15 0.06 0.30 0.10 0.14 0.24 0.13 0.04 0.24 0.07 0.06 0.07
Step by Step Solution
3.41 Rating (157 Votes )
There are 3 Steps involved in it
This exercise involves creating an S chart which tracks the sample standard deviations over time to monitor the variation within a process The chart c... View full answer

Get step-by-step solutions from verified subject matter experts