

Question: Make scatterplots for all pairwise combinations of the variables from the tree data (Table 1.7). Which pairs of variables have the strongest relationship? Is your
Make scatterplots for all pairwise combinations of the variables from the tree data
(Table 1.7). Which pairs of variables have the strongest relationship? Is your conclusion consistent with prior knowledge?
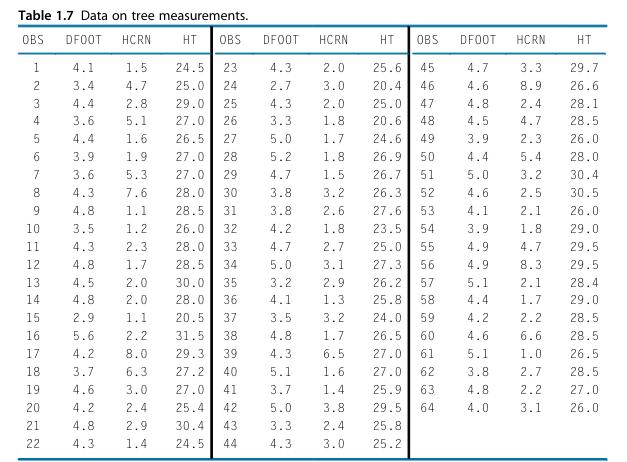
Table 1.7 Data on tree measurements. OBS DFOOT HCRN HT OBS DFOOT HCRN HT OBS DFOOT HCRN HT 1234 4.1 1.5 24.5 23 4.3 2.0 25.6 45 3.4 4.7 25.0 24 2.7 3.0 20.4 46 56 4.7 3.3 29.7 4.6 8.9 26.6 4.4 2.8 29.0 25 4.3 2.0 25.0 47 4.8 2.4 28.1 4 3.6 5.1 27.0 26 3.3 1.8 20.6 48 4.5 4.7 28.5 56900 4.4 1.6 26.5 27 5.0 1.7 24.6 49 3.9 2.3 26.0 3.9 1.9 27.0 28 5.2 1.8 26.9 50 4.4 5.4 28.0 7 3.6 5.3 27.0 29 4.7 1.5 26.7 51 5.0 3.2 30.4 8 4.3 7.6 28.0 30 3.8 3.2 26.3 52 4.6 2.5 30.5 9 4.8 1.1 28.5 31 3.8 2.6 27.6 53 4.1 2.1 26.0 10 3.5 1.2 26.0 32 4.2 1.8 23.5 54 3.9 1.8 29.0 11 4.3 2.3 28.0 33 4.7 2.7 25.0 55 4.9 4.7 29.5 12 4.8 1.7 28.5 34 5.0 3.1 27.3 56 4.9 8.3 29.5 13 4.5 2.0 30.0 35 3.2 2.9 26.2 57 5.1 2.1 28.4 14 4.8 2.0 28.0 36 4.1 1.3 25.8. 58 4.4 1.7 29.0 15 2.9 1.1 20.5 37 3.5 3.2 24.0 59 4.2 2.2 28.5 16 5.6 2.2 31.5 38 4.8 1.7 26.5 60 4.6 6.6 28.5 17 4.2 8.0 29.3 39 4.3 6.5 27.0 61 5.1 1.0 26.5 18 3.7 6.3 27.2 40 5.1 1.6 27.0 62 3.8 2.7 28.5 19 4.6 3.0 27.0 41 3.7 1.4 25.9 63 4.8 2.2 27.0 20 4.2 2.4 25.4 42 5.0 3.8 29.5 64 4.0 3.1 26.0 222 21 4.8 2.9 30.4 43 3.3 2.4 25.8 22 4.3 1.4 24.5 44 4.3 3.0 25.2
Step by Step Solution
3.34 Rating (154 Votes )
There are 3 Steps involved in it

Get step-by-step solutions from verified subject matter experts