

Question: Construct a frequency histogram and a relative frequency histogram using the data in Table 9. Approach The value of each category of data (number of
Construct a frequency histogram and a relative frequency histogram using the data in Table 9.
Approach The value of each category of data (number of customers) is on the horizontal axis and the frequency or relative frequency is on the vertical axis. Draw rectangles of equal width centered at the value of each category. For example, the first rectangle is centered at 1. For the frequency histogram, the height of the rectangle is the frequency of the category; for the relative frequency histogram, the height is the relative frequency of the category. Remember, the rectangles touch.
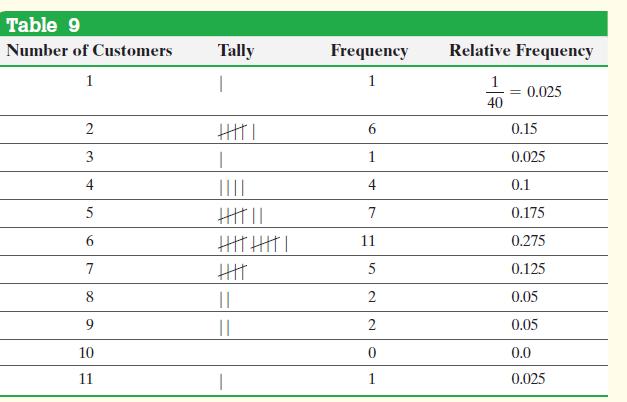
Table 9 Number of Customers Tally Frequency Relative Frequency 1 1 1 0.025 40 2 HHTI 6 0.15 3 1 0.025 4 5 IIII 4 0.1 7 0.175 6 7 8 9 10 HHHHHHTI 11 0.275 HH|| 5 0.125 || || 2 0.05 2 0.05 0 0.0 11 1 0.025
Step by Step Solution
3.39 Rating (152 Votes )
There are 3 Steps involved in it
Figures 7 a and ... View full answer

Get step-by-step solutions from verified subject matter experts