

The manager of a Wendys fast-food restaurant wants to know the typical number of customers who arrive
Question:
The manager of a Wendy’s fast-food restaurant wants to know the typical number of customers who arrive during the lunch hour. The data in Table 8 represent the number of customers who arrive at Wendy’s for 40 randomly selected 15-minute intervals of time during lunch. For example, during one 15-minute interval, seven customers arrived. Construct a frequency and relative frequency distribution of the data.
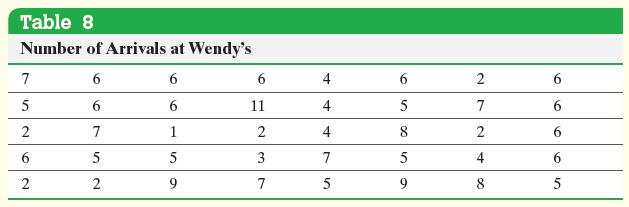
Approach The number of people arriving could be 0, 1, 2, 3, c. Table 8 shows there are 11 categories of data from this study: 1, 2, 3, c, 11. Tally the number of observations for each category, count each tally, and create the frequency and relative frequency distributions.
Step by Step Answer:
The two distributions are shown i...View the full answer


Statistics Informed Decisions Using Data
ISBN: 9781292157115
5th Global Edition
Authors: Michael Sullivan
