

Determine a 95% confidence interval for the slope of the true regression line for the data presented
Question:
Determine a 95% confidence interval for the slope of the true regression line for the data presented in Table 1 in Example 1.
By-Hand Approach
Step 1 Determine the least-squares regression line.
Step 2 Verify that the requirements for inference on the regression line are satisfied.
Step 3 Compute \(s_{e}\).
Step 4 Determine the critical value \(t_{\alpha / 2}\) with \(n-2\) degrees of freedom.
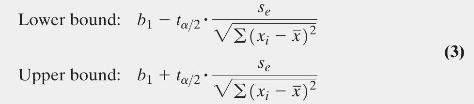
Step 5 Compute the bounds on the \((1-\alpha) \cdot 100 \%\) confidence interval for \(\beta_{1}\) using Formula (3).
Step 6 Interpret the result by stating, "We are 95\% confident that \(\beta_{1}\) is between lower bound and upper bound."
Technology Approach
Step 1 Use a statistical spreadsheet or graphing calculator with advanced statistical features to obtain the confidence interval. We will use StatCrunch. The steps for constructing confidence intervals using StatCrunch, the TI-83/84 Plus graphing calculators, Minitab, and Excel are given in the Technology Step-by-Step.
Step 2 Interpret the result.
Formula 3
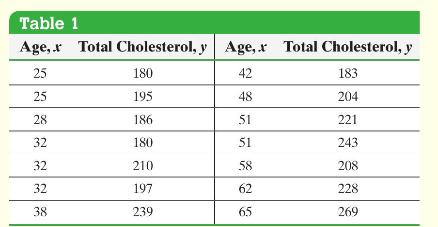
Data from Example 1
A family doctor is interested in examining the relationship between a patient's age and total cholesterol (in \(\mathrm{mg} / \mathrm{dL}\) ). He randomly selects 14 of his female patients and obtains the data presented in Table 1. The data are based on results obtained from the National Center for Health Statistics. Draw a scatter diagram, compute the correlation coefficient, find the least-squares regression equation, and determine the coefficient of determination.
Step by Step Answer:
ByHand Step 1 The leastsquares regression line was determined in Example 1 and is haty13991 x1513537 ...View the full answer


Statistics Informed Decisions Using Data
ISBN: 9781292157115
5th Global Edition
Authors: Michael Sullivan
