

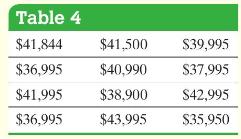
Table 4 shows the sale price of 12 randomly selected 6-year-old Chevy Corvettes. Construct a (90 %)
Question:
Table 4 shows the sale price of 12 randomly selected 6-year-old Chevy Corvettes. Construct a \(90 \%\) confidence interval for the population variance and standard deviation of the price of a 6- year-old Chevy Corvette.
Approach
Step 1 Verify the data are obtained randomly and the sample size is small relative to the population size. Because the sample size is small, draw a normal probability plot to verify the data come from a population that is normally distributed and a boxplot to verify that there are no outliers.
By-Hand Approach
Step 2 Compute the value of the sample variance, \(s^{2}\).
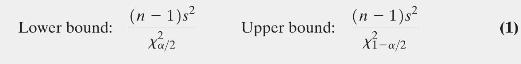
Step 3 Determine the critical values, \(\chi_{1-\alpha / 2}^{2}\) and \(\chi_{\alpha / 2}^{2}\), with \(n-1\) degrees of freedom.
Step 4 Use Formula (1) to determine the lower and upper bounds of the confidence interval for the population variance.
Step 5 Compute the square root of the lower bound and upper bound to obtain the confidence interval for the population standard deviation.
Technology Approach
Step 2 Use a statistical spreadsheet to obtain the confidence interval. We will use StatCrunch to construct the confidence interval. The steps for constructing confidence intervals using StatCrunch and Minitab are given in the Technology Step-by-Step.
Formula 1
Step by Step Answer:
Step 1 A normal probability plot and boxplot indicate that the price of Corvettes could be normally ...View the full answer


Statistics Informed Decisions Using Data
ISBN: 9781292157115
5th Global Edition
Authors: Michael Sullivan
