

Question: The data in Table 4 represent the finishing time (in seconds) for six randomly selected races of a greyhound named Barbies Bomber in the 5/16
The data in Table 4 represent the finishing time (in seconds) for six randomly selected races of a greyhound named Barbies Bomber in the 5/16 -mile race at Greyhound Park in Dubuque, Iowa. Is there evidence to support the belief that the variable “finishing time” is normally distributed?
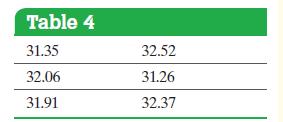
Table 4 31.35 32.52 32.06 31.26 31.91 32.37
Step by Step Solution
★★★★★
3.41 Rating (154 Votes )
There are 3 Steps involved in it
1 Expert Approved Answer
Step: 1 Unlock

Question Has Been Solved by an Expert!
Get step-by-step solutions from verified subject matter experts
Step: 2 Unlock
Step: 3 Unlock