

Question: The data in Table 6 on page 232 represent the club-head speed, the distance the golf ball traveled, and the residuals (Column 7) for eight
The data in Table 6 on page 232 represent the club-head speed, the distance the golf ball traveled, and the residuals (Column 7) for eight swings of a golf club. Construct a residual plot and boxplot of the residuals and comment on the appropriateness of the least-squares regression model.
Approach Plot the residuals on the vertical axis and the values of the explanatory variable on the horizontal axis. Look for any violations of the requirements of the regression model. We use a boxplot of the residuals to identify any outliers. We will use Minitab to generate the graphs.
Data from Table 6 on page 232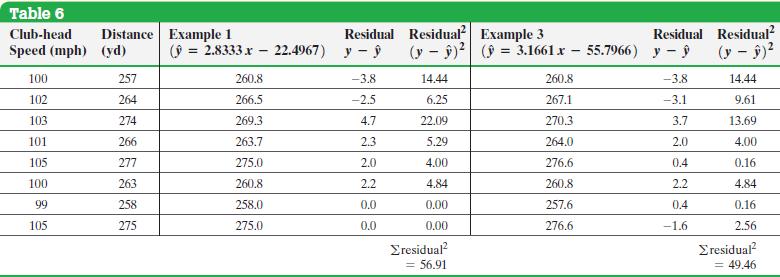
Table 6 Club-head Distance Example 1 Residual Residual Example 3 Residual Residual Speed (mph) (yd) ( = 2.8333x - 22.4967) y (y) (= 3.1661 x - 55.7966) y-y (y - ) 100 257 260.8 -3.8 14.44 260.8 -3.8 14.44 102 264 266.5 -2.5 6.25 267.1 -3.1 9.61 103 274 269.3 4.7 22.09 270.3 3.7 13.69 101 266 263.7 2.3 5.29 264.0 2.0 4.00 105 277 275.0 2.0 4.00 276.6 0.4 0.16 100 263 260.8 2.2 4.84 260.8 2.2 4.84 99 258 258.0 0.0 0.00 257.6 0.4 0.16 105 275 275.0 0.0 0.00 276.6 -1.6 2.56 residual residual = 56.91 = 49.46
Step by Step Solution
3.47 Rating (160 Votes )
There are 3 Steps involved in it
Figure 24a shows the residual plot and Figure 24b ... View full answer

Get step-by-step solutions from verified subject matter experts