

Question: Find the critical values that separate the middle (90 %) of the chi-square distribution from the 5% area in each tail, assuming 15 degrees of
Find the critical values that separate the middle \(90 \%\) of the chi-square distribution from the 5% area in each tail, assuming 15 degrees of freedom.
Approach Perform the following steps to obtain the critical values.
Step 1 Draw a chi-square distribution with the critical values and areas labeled.
Step 2 Use Table VIII to find the critical values.
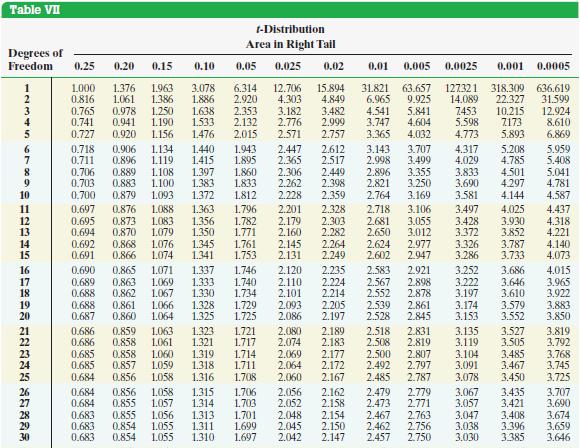
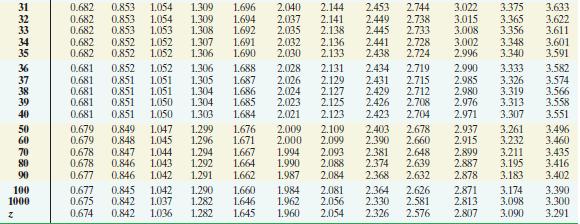
Table VII Degrees of Freedom t-Distribution Area in Right Tail 0.25 0.20 0.15 0.10 0.05 0.025 0.02 0.01 0.005 0.0025 0.001 0.0005 1.000 1.376 1.963 3.078 6.314 1345 67893 S 0.816 1.061 1.386 1.886 2.920 12.706 15.894 4.303 4.849 31.821 63.657 6.965 9.925 0.765 0.978 1.250 1.638 2.353 3.182 3.482 0.741 0.941 1.190 0.727 1.533 2.132 2.776 2.999 0.920 1.156 1.476 2.015 2.571 2.757 3.365 4.032 127321 318.309 636.619 14.089 22.327 31.599 4.541 5.841 7453 10.215 12.924 3.747 4.604 5.598 7173 8.610 4.773 5.893 6.869 0.718 0.906 1.134 1.440 1.943 2.447 2.612 3.143 3.707 4.317 5.208 5.959 0.711 0.896 1.119 1.415 1.895 2.365 2.517 2.998 3.499 4.029 4.785 5.408 0.706 0.889 1.108 1.397 1.860 2.306 2.449 2.896 3.355 3.833 4.501 5.041 0.703 0.883 1.100 1.383 1.833 2.262 2.398 2.821 3.250 3.690 4.297 4.781 10 0.700 0.879 1.093 1.372 1.812 2.228 2.359 2.764 3.169 3.581 4.144 4.587 11 0.697 0.876 1.088 1.363 1.796 2.201 2.328 2.718 3.106 3.497 4.025 4.437 12 0.695 0.873 1.083 1.356 1.782 2.179 2.303 2.681 3.055 3.428 3.930 4.318 13 0.694 0.870 1.079 1.350 1.771 2.160 2.282 2.650 3.012 3.372 3.852 4.221 14 0.692 0.868 1.076 1.345 1.761 2.145 2.264 2.624 2.977 3.326 3.787 4.140 15 0.691 0.866 1.074 1.341 1.753 2.131 2.249 2.602 2.947 3.286 3.733 4.073 16 0.690 0.865 1.071 1.337 1.746 2.120 2.235 2.583 2.921 3.252 3.686 4.015 17 0.689 0.863 1.069 1.333 1.740 2.110 2.224 2.567 2.898 3.222 3.646 3.965 18 0.688 0.862 1.067 1.330 1.734 2.101 2.214 2.552 2.878 3.197 3.610 3.922 19 0.688 0.861 1066 1.328 1.729 2.093 2.205 2.539 2.861 3.174 3.579 3.883 20 0.687 0.860 1.064 1.325 1.725 2.086 2.197 2.528 2.845 3.153 3.552 3.850 21 0.686 0.859 1.063 1.323 1.721 2.080 2.189 2.518 2.831 3.135 3.527 3.819 22 0.686 0.858 1.061 1.321 1.717 2.074 2.183 2.508 2.819 3.119 3.505 3.792 23 0.685 0.858 1.060 1.319 1.714 2.069 2.177 2.500 2.807 3.104 3.485 3.768 24 0.685 0.857 1.059 1.318 1.711 2.064 2.172 2.492 2.797 3.091 3.467 3.745 25 0.684 0.856 1.058 1.316 1.708 2.060 2.167 2.485 2.787 3.078 3.450 3.725 0.684 0.856 1.058 1.315 1.706 2.056 2.162 2.479 2.779 3.067 3.435 3.707 0.684 0.855 1.057 1.314 1.703 2.052 2.158 2.473 2.771 3.057 3.421 3.690 0.683 0.855 1.056 1.313 1.701 2.048 2.154 2.467 2.763 3.047 3.408 3.674 29 0.683 0.854 1.055 1.311 1.699 2.045 2.150 2.462 2.756 3.038 3.396 3.659 30 0.683 0.854 1.055 1.310 1.697 2.042 2.147 2.457 2.750 3.030 3.385 3.646
Step by Step Solution
3.54 Rating (151 Votes )
There are 3 Steps involved in it
Step 1 Figure 19 shows the chisquare distribution with ... View full answer

Get step-by-step solutions from verified subject matter experts