

Question: Refer to the data in Example 1. Use the standard deviation to determine whether University A or University B has more dispersion in its students
Refer to the data in Example 1. Use the standard deviation to determine whether University A or University B has more dispersion in its students’ IQ scores.
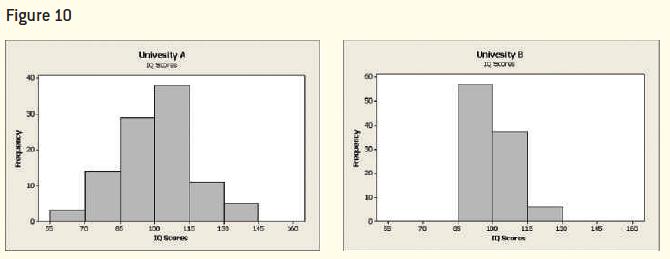
Approach We will use Minitab to determine the standard deviation of IQ for each university. The university with the higher standard deviation will be the university with more dispersion in IQ scores. The histograms shown in Figure 10 imply that University A has more dispersion. Therefore, we expect University A to have a higher sample standard deviation.
Data from Example 1
The data in Table 7 represent the IQ scores of a random sample of 100 students from two different universities. For each university, compute the mean IQ score and draw a histogram using a lower class limit of 55 for the first class and a class width of 15. Comment on the results.
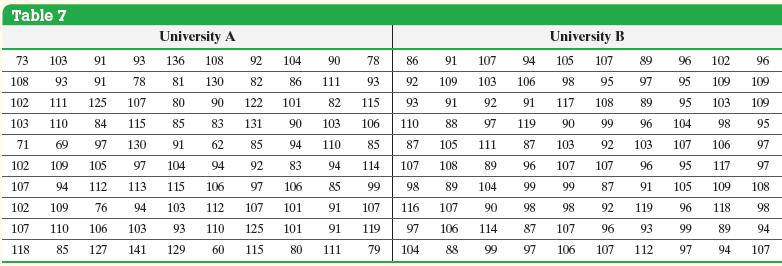
Figure 10 8 Ab 20 Univesity A 60- Univesity B 9 10 18 70 a 50- 40 8 Ab 100 13 145 10 Scar B 10- R B 100 130 160
Step by Step Solution
There are 3 Steps involved in it
Enter the data into Minitab and compute the d... View full answer

Get step-by-step solutions from verified subject matter experts