

Question: The data in Table 1 represent the probability distribution of the number of people living in households in the United States. Figure 6 shows a
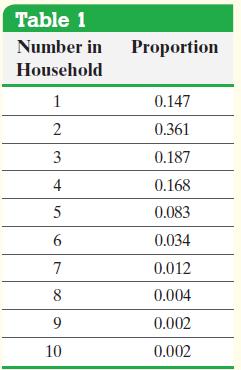
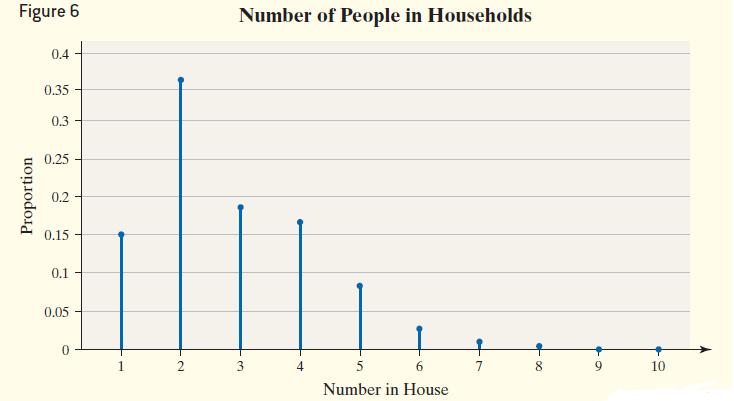
The data in Table 1 represent the probability distribution of the number of people living in households in the United States. Figure 6 shows a graph of the probability distribution. From the data in Table 1, we determine the mean and standard deviation number of people living in households in the United States to be μ = 2.9 and σ = 1.48.
Clearly, the distribution is not normal. In fact, the random variable is discrete!
Approximate the sampling distribution of the sample mean x by obtaining, through simulation, 1000 samples of size
(a) n = 4,
(b) n = 10, and
(c) n = 30 from the population.
Approach Use Minitab to obtain 1000 random samples of size n = 4 from the population.
This simulates going to 4 households 1000 times and determining the number of people living in the household. Next, compute the mean of each of the 1000 random samples.
Finally, draw a histogram, determine the mean, and determine the standard deviation of the 1000 sample means. Repeat this for samples of size n = 10 and n = 30.
Table 1 Number in Proportion Household 1 0.147 2 0.361 3 0.187 4 0.168 5 0.083 6 0.034 7 0.012 8 0.004 9 0.002 10 0.002
Step by Step Solution
3.49 Rating (159 Votes )
There are 3 Steps involved in it
Figure 7 shows partial output from Minitab for rand... View full answer

Get step-by-step solutions from verified subject matter experts