

Question: The data in Table 1.20 show statistics on the age distribution of Chinese victims of COVID-19. (These data, from China CDC Weekly, are dated February
The data in Table 1.20 show statistics on the age distribution of Chinese victims of COVID-19. (These data, from China CDC Weekly, are dated February 11, 2020, when the pandemic was well underway in China.)
(a) Produce relative frequency histograms for the ages of the cases and deaths.
To handle the open-ended “80+” class, use a bar whose base is the same width as for the other classes, but use a “break mark,” such as //, to draw the reader’s attention to its different scale.
(b) Compare the differences in the distributions for the cases and deaths. What is the most remarkable difference?
(c) Compute the death rate per 1000 cases (# deaths1000/# cases) for each age group. Plot the death rates versus the midpoint of each age class (use 85 for the last class). Write a short sentence describing the relationship.
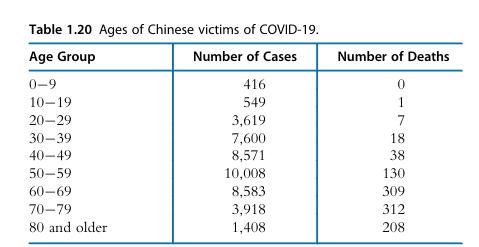
Table 1.20 Ages of Chinese victims of COVID-19. Age Group Number of Cases Number of Deaths 0-9 416 0 10-19 549 1 20-29 3,619 7 30-39 7,600 18 40-49 8,571 38 50-59 10,008 130 60-69 8,583 309 70-79 3,918 312 80 and older 1,408 208
Step by Step Solution
There are 3 Steps involved in it

Get step-by-step solutions from verified subject matter experts