

Question: The data in Table 4 represent the educational attainment in 1990 and 2013 of adults 25 years and older who are residents of the United
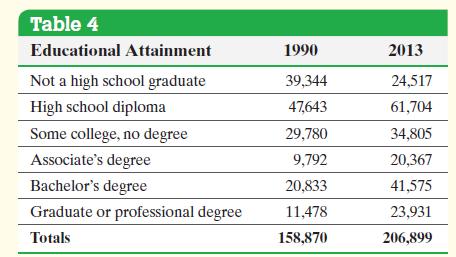
The data in Table 4 represent the educational attainment in 1990 and 2013 of adults 25 years and older who are residents of the United States. The data are in thousands. So 39,344 represents 39,344,000.
(a) Draw a side-by-side relative frequency bar graph of the data.
(b) Make some general conclusions based on the graph.
Approach First, determine the relative frequencies of each category for each year. To construct side-by-side bar graphs, draw two bars for each category of data, one for 1990, the other for 2013.
Table 4 Educational Attainment 1990 2013 Not a high school graduate 39,344 24,517 High school diploma 47,643 61,704 Some college, no degree 29,780 34,805 Associate's degree 9,792 20,367 Bachelor's degree 20,833 41,575 Graduate or professional degree 11,478 23,931 Totals 158,870 206,899
Step by Step Solution
There are 3 Steps involved in it
Table 5 shows the relative frequency for each categ... View full answer

Get step-by-step solutions from verified subject matter experts