

Compare the sum of squared residuals for the lines in Examples 1 and 3. Approach Use a
Question:
Compare the sum of squared residuals for the lines in Examples 1 and 3.
Approach Use a table to compute ∑residuals2 using the predicted values of y, ŷ, for the equations in Examples 1 and 3.
Data from Example 1
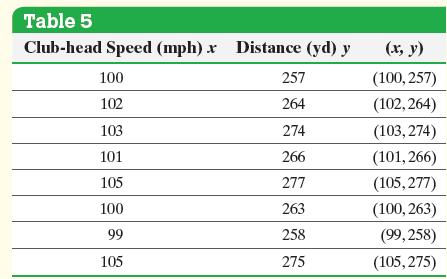
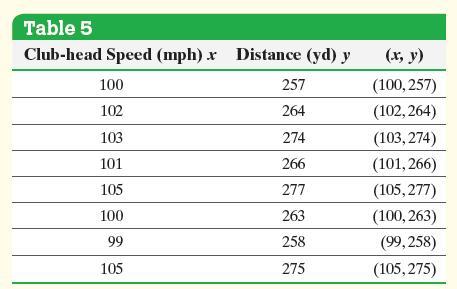
The data in Table 5 represent the club-head speed and the distance a golf ball travels for eight swings of the club. We found that these data are linearly related .
Data from Example 3
Use the golf data in Table 5.
Find the least-squares regression line.
Draw the least-squares regression line on the scatter diagram of the data.
Predict the distance a golf ball will travel when hit with a club-head speed of 103 miles per hour (mph).
Determine the residual for the predicted value found in part (c). Is the distance in Table 5 above average or below average among all balls hit with a swing speed of 103 mph?
Step by Step Answer:


Statistics Informed Decisions Using Data
ISBN: 9781292157115
5th Global Edition
Authors: Michael Sullivan
