

Question: The following data, obtained from the U.S. Census Bureau, represent the population of the United States. An ecologist is interested in finding an equation that
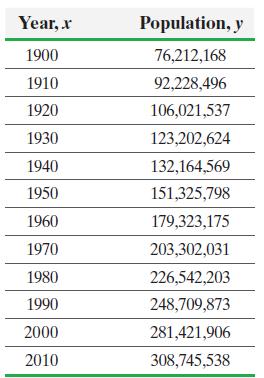
The following data, obtained from the U.S. Census Bureau, represent the population of the United States. An ecologist is interested in finding an equation that describes the population of the United States over time. She is convinced that the population is growing exponentially
(a) Draw a scatter diagram treating time as the explanatory variable.
(b) Determine the logarithm of the y-values so that Y = log y. Draw a scatter diagram of the transformed data.
(c) Find the least-squares regression line of the transformed data.
(d) Find the exponential equation of best fit.
(e) Use the exponential equation of best fit to predict the population of the United States in 2020, the year of the next census.
(f) Do you think your prediction will overestimate or underestimate the actual population in 2020? Why?
Year, x Population, y 1900 76,212,168 1910 92,228,496 1920 106,021,537 1930 123,202,624 1940 132,164,569 1950 151,325,798 1960 179,323,175 1970 203,302,031 1980 226,542,203 1990 248,709,873 2000 281,421,906 2010 308,745,538
Step by Step Solution
3.21 Rating (151 Votes )
There are 3 Steps involved in it

Get step-by-step solutions from verified subject matter experts