

Question: The graph of a normal curve is given. Use the graph to identify the values of and . 230 330 430 530 630 730
The graph of a normal curve is given. Use the graph to identify the values of μ and σ.
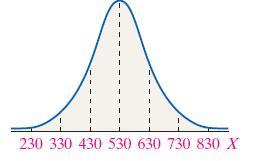
230 330 430 530 630 730 830 X
Step by Step Solution
★★★★★
3.41 Rating (164 Votes )
There are 3 Steps involved in it
1 Expert Approved Answer
Step: 1 Unlock

Question Has Been Solved by an Expert!
Get step-by-step solutions from verified subject matter experts
Step: 2 Unlock
Step: 3 Unlock