

Question: Use statistical software or a graphing calculator to find the mean and the standard deviation of the random variable whose distribution is given in Table
Use statistical software or a graphing calculator to find the mean and the standard deviation of the random variable whose distribution is given in Table 1.
Approach We will use a TI-84 Plus C graphing calculator to obtain the mean and standard deviation. The steps for determining the mean and standard deviation using a TI-83/84 Plus graphing calculator and StatCrunch are given in the Technology Step by- Step.
Table 1
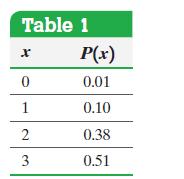
Table 1 x P(x) 0 0.01 1 0.10 2 0.38 3 0.51
Step by Step Solution
★★★★★
3.48 Rating (161 Votes )
There are 3 Steps involved in it
1 Expert Approved Answer
Step: 1 Unlock

Figure 4 shows the resul... View full answer
Question Has Been Solved by an Expert!
Get step-by-step solutions from verified subject matter experts
Step: 2 Unlock
Step: 3 Unlock