

Question: Using the data presented in Table 5: (a) Find the correlation matrix among all three variables. (b) Find the least-squares regression model using both (x_{1})
Using the data presented in Table 5:
(a) Find the correlation matrix among all three variables.
(b) Find the least-squares regression model using both \(x_{1}\) and \(x_{2}\) as explanatory variables.
(c) Comment on the effect that including both \(x_{1}\) and \(x_{2}\) has on the \(t\)-test statistics.
Approach We will use StatCrunch to conduct the analysis.
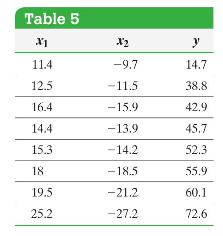
Table 5 X1 12 y 11.4 -9.7 14.7 12.5 -11.5 38.8 16.4 -15.9 42.9 14.4 -13.9 45.7 15.3 -14.2 52.3 18 -18.5 55.9 19.5 -21.2 60.1 25.2 -27.2 72.6
Step by Step Solution
3.55 Rating (159 Votes )
There are 3 Steps involved in it
a Figure 19 shows the correlation matrix An extremely high correlation exists between x1 and x2 so m... View full answer

Get step-by-step solutions from verified subject matter experts