

Question: Create a scatterplot for the last two variables in Table 3.1 (i.e., Sibling understands me and Language development). Note that some subjects dots will be
Create a scatterplot for the last two variables in Table 3.1 (i.e., “Sibling understands me” and “Language development”). Note that some subjects’ dots will be on top of each other in this scatterplot.
a. What does this scatterplot tell you about your subjects?
b. What does this scatterplot tell you about the two variables in the dataset?
Table 3.1
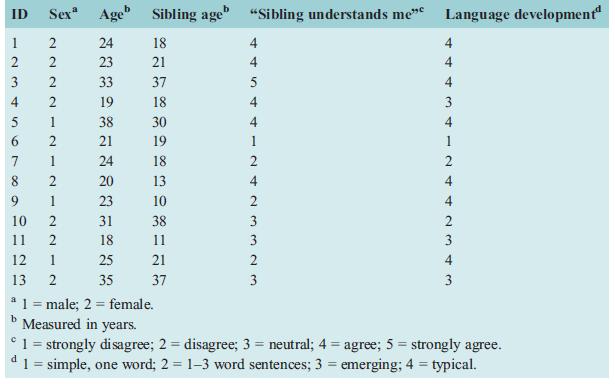
ID Sex* Age" Sibling age" "Sibling understands mee Language development 24 18 4 23 21 4 3 33 37 5 4 19 18 4 3 5 38 30 4 4 6. 21 19 1 1 7 1 24 18 20 13 4 4 9. 1 23 10 2 4. 10 31 38 3 11 2 18 11 3 3 12 1 25 21 4 13 2 35 37 3 3 *1 = male; 2 = female. Measured in years. 1= strongly disagree; 2 = disagree; 3 = neutral; 4 = agree; 5 = strongly agree. 1 = simple, one word; 2 = 1-3 word sentences; 3 = emerging; 4 = typical. d %3D
Step by Step Solution
3.30 Rating (171 Votes )
There are 3 Steps involved in it
To create a scatterplot for the variables Sibling understands me and Language development from Table 31 you would typically use a statistical software ... View full answer

Get step-by-step solutions from verified subject matter experts