Using the data in Table 3.1, make a frequency table and a histogram for the language development
Question:
Using the data in Table 3.1, make a frequency table and a histogram for the language development variable data in the Waite et al. (2015) study.
Table 3.1
Transcribed Image Text:
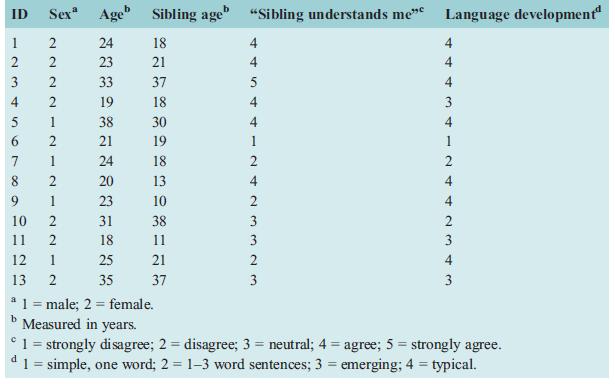
ID Sex* Age" Sibling age" "Sibling understands mee Language development 24 18 4 23 21 4 3 33 37 5 4 19 18 4 3 5 38 30 4 4 6. 21 19 1 1 7 1 24 18 20 13 4 4 9. 1 23 10 2 4. 10 31 38 3 11 2 18 11 3 3 12 1 25 21 4 13 2 35 37 3 3 *1 = male; 2 = female. Measured in years. °1= strongly disagree; 2 = disagree; 3 = neutral; 4 = agree; 5 = strongly agree. 1 = simple, one word; 2 = 1-3 word sentences; 3 = emerging; 4 = typical. d %3D
Fantastic news! We've Found the answer you've been seeking!
Step by Step Answer:
Answer rating: 73% (15 reviews)
ANSWER To create a frequency table and a histogram for the language development variable data in ...View the full answer
Answered By
Surendar Kumaradevan
I have worked with both teachers and students to offer specialized help with everything from grammar and vocabulary to challenging problem-solving in a range of academic disciplines. For each student's specific needs, I can offer explanations, examples, and practice tasks that will help them better understand complex ideas and develop their skills.
I employ a range of techniques and resources in my engaged, interesting tutoring sessions to keep students motivated and on task. I have the tools necessary to offer students the support and direction they require in order to achieve, whether they need assistance with their homework, test preparation, or simply want to hone their skills in a particular subject area.
0.00
0 Reviews
10+ Question Solved
Related Book For
Statistics For The Social Sciences A General Linear Model Approach
ISBN: 9781107576971
1st Edition
Authors: Russell T. Warne
Question Posted:
Students also viewed these Mathematics questions
-
Create a pie chart showing the percentage of subjects in Table 3.1 who gave each response for the language development data in the Waite et al. (2015) study. Table 3.1
-
(a) Draw a simple frequency polygon using the data in question 23. (b) Draw a relative frequency histogram of these data. In Question 23 16 1 13 12 1 16 12 16 15 16 11 13 16 1211
-
Using the data in Table 17.13: a. Calculate x and and then find the center lines and control limits for x and R charts for the camshaft hardness depths. b. Set up the x and R charts for the camshaft...
-
What is the benefit to a company from a securities underwriter? They study the market and advise companies on where to set their IPO share price. They help companies to reduce the risk associated...
-
A motor drives a shaft at 12 Hz and delivers 20 kW of power (see figure). (b) If the maximum allowable shear stress is 40 MPa, what is the minimum permissible diameter dmin of the shaft? 12 Hz 20 kW
-
A $10,000 U.S. Government bond has a 7 percent coupon which pays annually and matures in 6 years. If interest rates are 8 percent for similar bonds, what should be the price for this bond? Mark...
-
Identify treatments and experimental units in the following scenarios. a. City A would like to evaluate whether a new employment training program for the unemployed is more effective compared to the...
-
A Bloomberg Businessweek North American subscriber study collected data from a sample of 2861 subscribers. Fifty-nine percent of the respondents indicated an annual income of $75,000 or more and 50%...
-
Aaron, Inc. loans Baker Company $ 4 5 , 0 0 0 on an 8 % note receivable due in six months. When Aaron is repaid, what is the total amount received?
-
What is a decision statement? How does the focus on an irrelevant decision affect the research process?
-
When comparing the frequency tables in this chapter (Table 3.3 and the frequency table in the guided practice section), Myeongsun noticed that the proportions in the bottom row of each table (labeled...
-
A distribution has skewness of 2.5 and a kurtosis of +1.8. a. Draw approximately what this distribution should look like. b. What terms would you use to describe this distribution?
-
A cypress beam found in the tomb of Sneferu in Egypt contained 55% of the amount of Carbon-14 found in living cypress wood. Estimate the age of the tomb.
-
Indicate whether each of the following statements is true or false by writing T or F i n t he a nswer c olumn. Environmental and safety regulations seldom act as legal restraints of trade even though...
-
Software games company, Avalanche Entertainment, is considering expanding its highly successful online game franchise to the board game or trading card environment. The company has decided that it...
-
Indicate whether each of the following statements is true or false by writing T or F i n t he a nswer c olumn. It is perfectly safe to purchase prescription drugs over the Internet.
-
Has the NFL been foolish to allow Los Angeles to go so long without a team?
-
Indicate whether each of the following statements is true or false by writing T or F in the answer column. An insurance agent or broker can be charged with negligence only if he or she cancels a...
-
Why is this statement wrong: "Economists argue that lower prices will result in fewer units being supplied. However, there are exceptions to this rule. For example, in 1972, a very simple 10-digit...
-
On January 2, 20X3, Sheldon Bass, a professional engineer, moved from Calgary to Edmonton to commence employment with Acco Ltd., a large public corporation. Because of his new employment contract,...
-
You notice in your introductory psychology class that more women tend to sit up front, and more men sit in the back. To determine whether this difference is significant, you collect data on the...
-
A researcher believes that the percentage of people who exercise in California is greater than the national exercise rate. The national rate is 20%. The researcher gathers a random sample of 120...
-
When is it appropriate to use a 2 test?
-
Pangasa Co. paid its annual worker accident insurance premium of $48,000 on its manufacturing facility in January. The company expects two worker accidents to happen during the year, and to make...
-
3. The game of baseball is often analyzed using Markov models. The state of the game can be represented by listing bases that have runners and keeping track of how many outs there are. There are...
-
Thornton Electronics currently produces the shipping containers it uses to deliver the electronics products it sells. The monthly cost of producing 9,300 containers follows. Unit-level materials...
Study smarter with the SolutionInn App