

Question: A scatterplot with regression line is shown in Figure 9.7 for a regression model using Verbal SAT score, VerbalSAT, to predict grade point average in
Figure 9.7
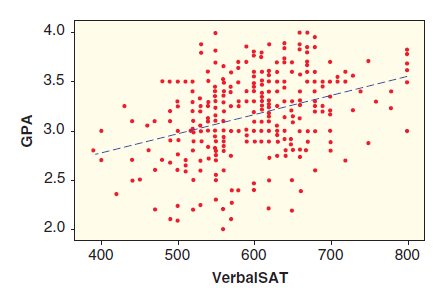
(a) Use the scatterplot to determine whether we should have any significant concerns about the conditions being met for using a linear model with these data.
(b) Use the fitted model to predict the GPA of a person with a score on the Verbal SAT exam of 650.
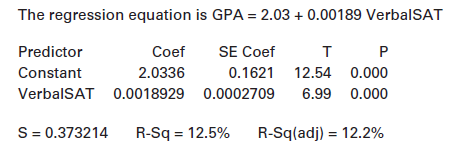
(c) What is the estimated slope in this regression model? Interpret the slope in context.
(d) What is the test statistic for a test of the slope? What is the p-value? What is the conclusion of the test, in context?
(e) What is R2? Interpret it in context.
4.0. 3.5 3.0 2.5- 2.0 500 400 600 700 800 VerbalSAT GPA The regression equation is GPA = 2.03 + 0.00189 VerbalSAT Predictor Constant VerbalSAT 0.0018929 0.0002709 Coef 2.0336 SE Coef 0.1621 12.54 0.000 6.99 0.000 S = 0.373214 R-Sq(adj) = 12.2% %3D R-Sq = 12.5%
Step by Step Solution
3.57 Rating (150 Votes )
There are 3 Steps involved in it
a On the scatterplot we have concerns if there is a curved pattern there isnt or variability from th... View full answer

Get step-by-step solutions from verified subject matter experts