

Question: Answer the same questions using Figure 6.10 as in Exercise 6.100 except assume that each histogram represents only 15 homes. Is the t-distribution appropriate to
Answer the same questions using Figure 6.10 as in Exercise 6.100 except assume that each histogram represents only 15 homes. Is the t-distribution appropriate to model sample means of housing price from New York? New Jersey? Pennsylvania?
Figure 6.10
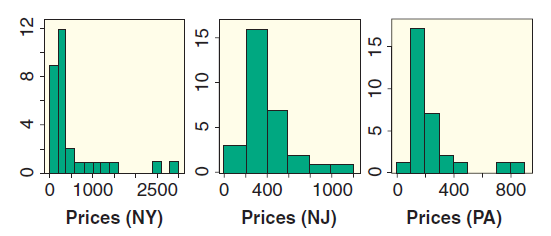
LII O 1000 0 400 400 2500 1000 800 Prices (NY) Prices (NJ) Prices (PA)
Step by Step Solution
★★★★★
3.25 Rating (154 Votes )
There are 3 Steps involved in it
1 Expert Approved Answer
Step: 1 Unlock

Definitely not ... View full answer
Question Has Been Solved by an Expert!
Get step-by-step solutions from verified subject matter experts
Step: 2 Unlock
Step: 3 Unlock