

Question: Examples 47 used multiple regression to predict total body weight of college athletes in terms of height, percent body fat, and age. The following figure
Examples 4€“7 used multiple regression to predict total body weight of college athletes in terms of height, percent body fat, and age. The following figure shows a histogram of the standardized residuals resulting from fitting this model.
a. About which distribution do these give you information€” the overall distribution of weight or the conditional distribution of weight at fixed values of the predictors?
b. What does the histogram suggest about the likely shape of this distribution? Why?
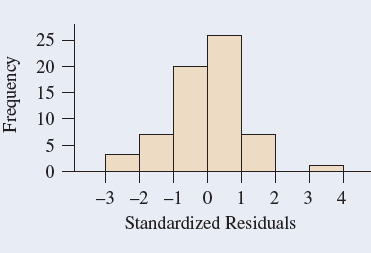
25 20 15 10 -3 -2 -1 0 1 2 3 Standardized Residuals Frequency
Step by Step Solution
3.40 Rating (166 Votes )
There are 3 Steps involved in it
a These give us information about the conditional distri... View full answer

Get step-by-step solutions from verified subject matter experts
Document Format (2 attachments)
1544_605d88e2018fc_676037.pdf
180 KBs PDF File
1544_605d88e2018fc_676037.docx
120 KBs Word File