

Figure 2.43 shows side-by-side boxplots comparing calorie consumption by gender. Figure 2.43 (a) Which gender has the
Question:
Figure 2.43
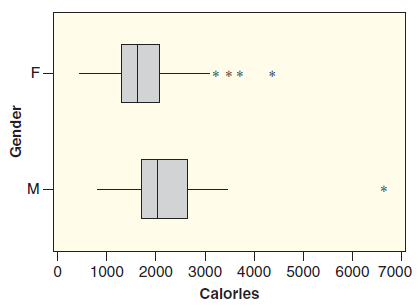
(a) Which gender has the largest median daily calorie consumption? Which gender has the largest outlier? Which gender has the most outliers?
(b) Does there seem to be an association between gender and calorie consumption? Explain.
Use data from Nutrition-Study on dietary variables and concentrations of micronutrients in the blood for a sample of n = 315 individuals.
Fantastic news! We've Found the answer you've been seeking!
Step by Step Answer:
a The median appears to be about 500 calories higher for the males than for the females The la...View the full answer

Answered By
Jeff Omollo
As an educator I have had the opportunity to work with students of all ages and backgrounds. Throughout my career, I have developed a teaching style that encourages student engagement and promotes active learning. My education and tutoring skills has enabled me to empower students to become lifelong learners.
5+ Reviews
42+ Question Solved
Related Book For 

Statistics Unlocking The Power Of Data
ISBN: 9780470601877
1st Edition
Authors: Robin H. Lock, Patti Frazer Lock, Kari Lock Morgan, Eric F. Lock, Dennis F. Lock
Question Posted:
