

Figure A.11 shows a histogram of the heart rate data, in beats per minute, from ICUAdmissions. The
Question:
Figure A.11
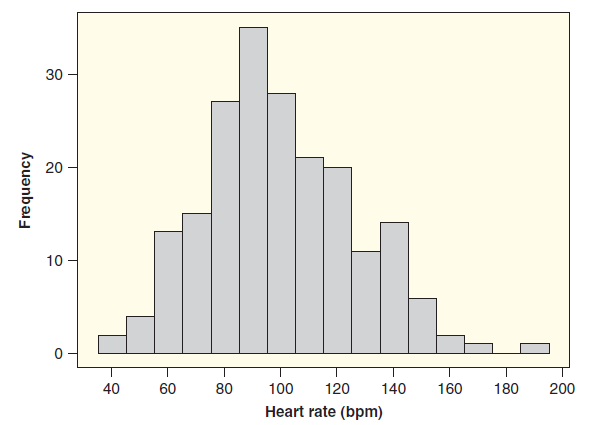
(a) Estimate the mean and the standard deviation.
(b) Estimate the 10th percentile and interpret it.
(c) Estimate the range.
Fantastic news! We've Found the answer you've been seeking!
Step by Step Answer:
a The mean is the balance point of the histogram and appears to be at ...View the full answer

Answered By
Mumthas Beegom
Highly motivated and competent mathematics teacher with 15 years of experience in teaching (10 years official + 5 years Private teaching). Taught Algebra, Calculus, Trigonometry, and Statistics in various classes.
0 Reviews
10+ Question Solved
Related Book For 

Statistics Unlocking The Power Of Data
ISBN: 9780470601877
1st Edition
Authors: Robin H. Lock, Patti Frazer Lock, Kari Lock Morgan, Eric F. Lock, Dennis F. Lock
Question Posted:
