

Question: For the study in Exercise 4.135, use StatKey or other technology to create the randomization distribution for this data. Use the distribution to calculate a
For the study in Exercise 4.135, use StatKey or other technology to create the randomization distribution for this data. Use the distribution to calculate a p-value for the test, and compare this p-value to the one given in Exercise 4.135(e). Use the p-value obtained in this exercise to assess the strength of evidence against the null hypothesis, in context.
Exercise 4.135
In 1980, the active ingredient in marijuana was shown to outperform a placebo in reducing nausea in chemotherapy patients, with a p-value of 0.0004. Many studies are now underway to see if the drug has additional medicinal uses. In one controlled, randomized trial, 55 patients with HIV were randomly assigned to two groups, with one group getting cannabis (marijuana) and the other getting a placebo. All of the patients had severe neuropathic pain, and the response variable is whether or not pain was reduced by 30% or more (a standard benchmark in pain measurement). The results are shown in Table 4.15. The question of interest is whether marijuana is more effective than a placebo in relieving pain.
Table 4.15
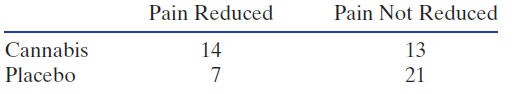
(e) What is the observed statistic from the sample? If the p-value for this test is 0.02, locate the observed statistic on your rough sketch of the randomization distribution.
Pain Not Reduced Pain Reduced Cannabis 14 13 21 Placebo
Step by Step Solution
3.27 Rating (168 Votes )
There are 3 Steps involved in it
Using StatKey or other technology we create randomization samples by randomly assigning the actual ... View full answer

Get step-by-step solutions from verified subject matter experts