

In an experiment investigating body language (M. Koppensteiner et al., Personality and Individual Differences, vol. 74, 2015,
Question:
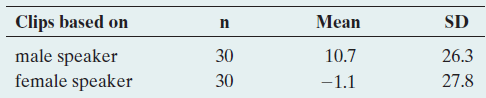
a. Set up the hypotheses for a significance test to analyze whether the population mean score differs between clips based on a male or female speaker.
b. Using software in which you can use summary statistics (or access the data set at the book€™s website), find the P-value for the significance test. Interpret it and report the conclusion for a significance level of 0.05.
c. If you were to construct a 95% confidence interval for the difference in population means, would it contain 0? Answer based on the result of part b, without actually finding the interval.
Fantastic news! We've Found the answer you've been seeking!
Step by Step Answer:
a H 0 1 2 H a 1 2 where 1 is the population mean score for clips based on male s...View the full answer

Answered By
Somshukla Chakraborty
I have a teaching experience of more than 4 years by now in diverse subjects like History,Geography,Political Science,Sociology,Business Enterprise,Economics,Environmental Management etc.I teach students from classes 9-12 and undergraduate students.I boards I handle are IB,IGCSE, state boards,ICSE, CBSE.I am passionate about teaching.Full satisfaction of the students is my main goal.
I have completed my graduation and master's in history from Jadavpur University Kolkata,India in 2012 and I have completed my B.Ed from the same University in 2013. I have taught in a reputed school of Kolkata (subjects-History,Geography,Civics,Political Science) from 2014-2016.I worked as a guest lecturer of history in a college of Kolkata for 2 years teaching students of 1st ,2nd and 3rd year. I taught Ancient and Modern Indian history there.I have taught in another school in Mohali,Punjab teaching students from classes 9-12.Presently I am working as an online tutor with concept tutors,Bangalore,India(Carve Niche Pvt.Ltd.) for the last 1year and also have been appointed as an online history tutor by Course Hero(California,U.S) and Vidyalai.com(Chennai,India).
2+ Reviews
10+ Question Solved
Related Book For 

Statistics The Art And Science Of Learning From Data
ISBN: 9780321997838
4th Edition
Authors: Alan Agresti, Christine A. Franklin, Bernhard Klingenberg
Question Posted:
