

Question: In Exercise 9.19, we give computer output for a regression line to predict the number of Facebook friends a student will have, based on a
In Exercise 9.19, we give computer output for a regression line to predict the number of Facebook friends a student will have, based on a normalized score of the grey matter density in the areas of the brain associated with social perception and associative memory. Data for the sample of n = 40 students are stored in FacebookFriends.
(a) What is the slope in this regression analysis? What is the standard error for the slope?
(b) Use the information from part (a) to calculate the test statistic to test the slope to determine whether GMdensity is an effective predictor of FBfriends. Give the hypotheses for the test, find the p-value, and make a conclusion. Show your work. Verify the values of the test statistic and the p-value using the computer output in Exercise 9.19.
(c) Use the information from part (a) to find and interpret a 95% confidence interval for the slope.
Exercise 9.19
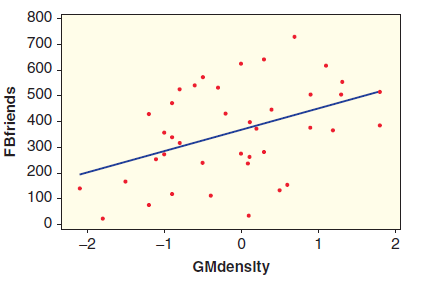
A recent study in Great Britain examines the relationship between the number of friends an individual has on Facebook and grey matter density in the areas of the brain associated with social perception and associative memory. The data are available in the dataset FacebookFriends and the relevant variables are GMdensity (normalized z-scores of grey matter density in the relevant regions) and FBfriends (the number of friends on Facebook). The study included 40 students at City University London. A scatterplot of the data is shown in Figure 9.9 and computer output for both correlation and regression is shown below.
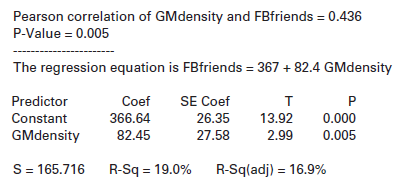
Figure 9.9
Pearson correlation of GMdensity and FBfriends = 0.436 P-Value = 0.005 The regression equation is FBfriends = 367 + 82.4 GMdensity SE Coef 26.35 Coef Predictor P 0.000 Constant 366.64 13.92 82.45 GMdensity 27.58 2.99 0.005 R-Sq = 19.0% S= 165.716 R-Sqladj) = 16.9% 800 700 600 500 400 300 200 100 0. -2 -1 1 GMdenslty FBfriends
Step by Step Solution
3.29 Rating (167 Votes )
There are 3 Steps involved in it
a We see in the output that the estimated slope is b 1 8245 and the standard error of the slope is 2... View full answer

Get step-by-step solutions from verified subject matter experts