

Question: Is drinking alcohol a possible factor in students missing classes? In Data D.1 on page 599, we introduce the data in SleepStudy. Two of the
Residual standard error: 3.237 on 251 degrees of freedom
Multiple R-squared: 0.006131, Adjusted R-squared: 0.002172
F-statistic: 1.548 on 1 and 251 DF, p-value: 0.2145
(a) Interpret the slope of the regression line in context.
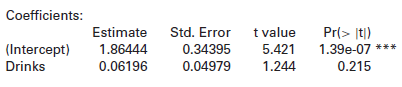
(b) Identify the t-statistic and the p-value for testing the slope. What is the conclusion, at a 5% level?
(c) Interpret R2 in context.
(d) Identify the F-statistic and p-value from the ANOVA for regression. What is the conclusion of that test?
Data D.1 on page 599
A recent study examines the relationship between class start times, sleep, circadian preference, alcohol use, academic performance, and other variables in college students. The data were obtained from a sample of students who did skills tests to measure cognitive function, completed a survey that asked many questions about attitudes and habits, and kept a sleep diary to record time and quality of sleep over a two-week period. Some data from this study are available in SleepStudy.
Coefficients: Std. Error 0.34395 0.04979 Pr(> It) 1.39e-07 *** t value 5.421 Estimate 1.86444 0.06196 | (Intercept) Drinks 1.244 0.215
Step by Step Solution
3.50 Rating (163 Votes )
There are 3 Steps involved in it
a The slope is b 1 00620 If the number of drinks goes u... View full answer

Get step-by-step solutions from verified subject matter experts