

Question: Make a scatterplot of the data. Put the X variable on the horizontal axis and the Y variable on the vertical axis. 15 50 25
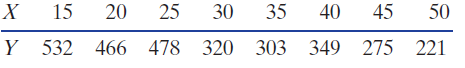
15 50 25 30 35 40 45 303 349 275 221 |Y 532 466 478 320
Step by Step Solution
★★★★★
3.38 Rating (170 Votes )
There are 3 Steps involved in it
1 Expert Approved Answer
Step: 1 Unlock

See the figur... View full answer
Question Has Been Solved by an Expert!
Get step-by-step solutions from verified subject matter experts
Step: 2 Unlock
Step: 3 Unlock