

Question: Make a scatterplot of the data. Put the X variable on the horizontal axis and the Y variable on the vertical axis. 3 5 2
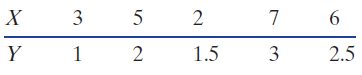
3 5 2 6. 1.5 3 2.5 2.
Step by Step Solution
★★★★★
3.34 Rating (172 Votes )
There are 3 Steps involved in it
1 Expert Approved Answer
Step: 1 Unlock

See the f... View full answer
Question Has Been Solved by an Expert!
Get step-by-step solutions from verified subject matter experts
Step: 2 Unlock
Step: 3 Unlock