

Suppose that 5% of the screws a company sells are defective. Figure 3.9 shows sample proportions from
Question:
One shows samples of size 100, and the other shows samples of size 1000.
Figure 3.9
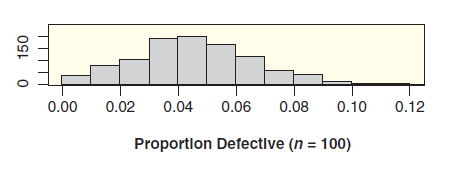
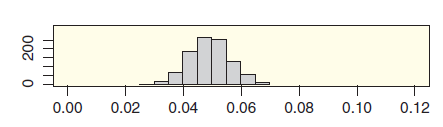
(a) What is the center of both distributions?
(b) What is the approximate minimum and maximum of each distribution?
(c) Give a rough estimate of the standard error in each case.
(d) Suppose you take one more sample in each case. Would a sample proportion of 0.08 (that is, 8% defective in the sample) be reasonably likely from a sample of size 100? Would it be reasonably likely from a sample of size 1000?
Fantastic news! We've Found the answer you've been seeking!
Step by Step Answer:
a Both distributions are centered at the population parame...View the full answer

Answered By
Susan Juma
I'm available and reachable 24/7. I have high experience in helping students with their assignments, proposals, and dissertations. Most importantly, I'm a professional accountant and I can handle all kinds of accounting and finance problems.
15+ Reviews
45+ Question Solved
Related Book For 

Statistics Unlocking The Power Of Data
ISBN: 9780470601877
1st Edition
Authors: Robin H. Lock, Patti Frazer Lock, Kari Lock Morgan, Eric F. Lock, Dennis F. Lock
Question Posted:
