

Question: The latest US Census lists the average household size for all households in the US as 2.61. (A household is all people occupying a housing
Figure 3.6
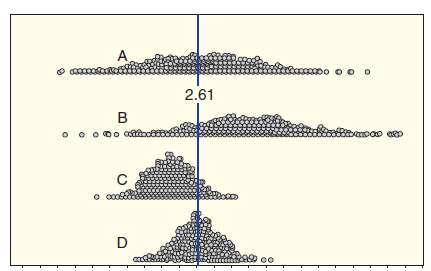 (a) Assume that two of the distributions show results from 1000 random samples, while two others show distributions from a sampling method that is biased. Which two dotplots appear to show samples produced using a biased sampling method? Explain your reasoning. Pick one of the distributions that you listed as biased and describe a sampling method that might produce this bias.
(b) For the two distributions that appear to show results from random samples, suppose that one comes from 1000 samples of size n = 100 and one comes from 1000 samples of size n = 500. Which distribution goes with which sample size? Explain.
coDo o o o 2.61 bd D
Step by Step Solution
3.35 Rating (167 Votes )
There are 3 Steps involved in it
a The two distributions centered at the population averag... View full answer

Get step-by-step solutions from verified subject matter experts